Top Plastic Waste Countries: Who Leads the Waste Crisis?
Plastic Waste Comparison Tool
Compare Waste Metrics
Country Comparison
How This Compares to Solutions
Germany (68% recycling) demonstrates how policy changes can dramatically reduce waste impact. For countries with lower recycling rates like Indonesia (19%), improved collection infrastructure could cut ocean pollution by up to 40%.
Every 10% increase in recycling rate reduces annual waste by approximately 5.5 million tonnes globally.
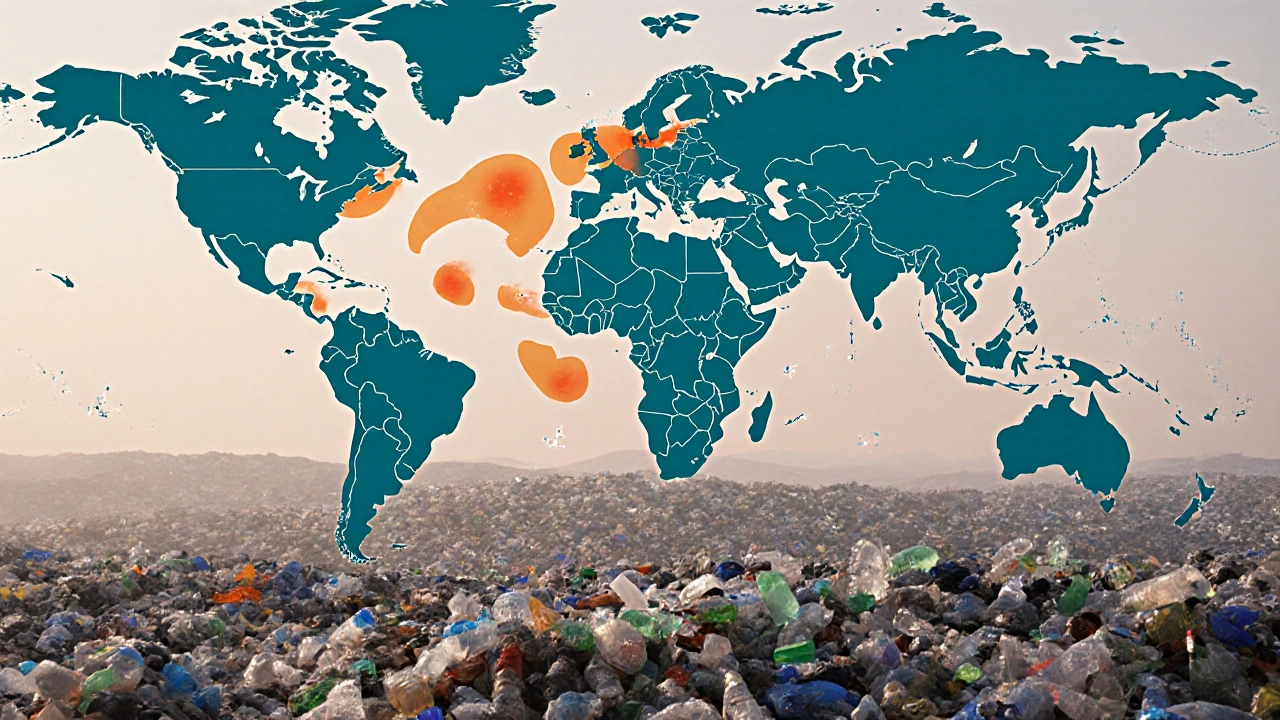
When the world talks about plastic waste, the numbers often swirl around oceans, wildlife, and headlines, but the root of the problem starts on land - in the places that produce the most discarded plastic each year. Understanding which nation tops the waste chart helps policymakers, activists, and everyday citizens see where the biggest gaps lie and how to target solutions.
How We Measure Plastic Waste
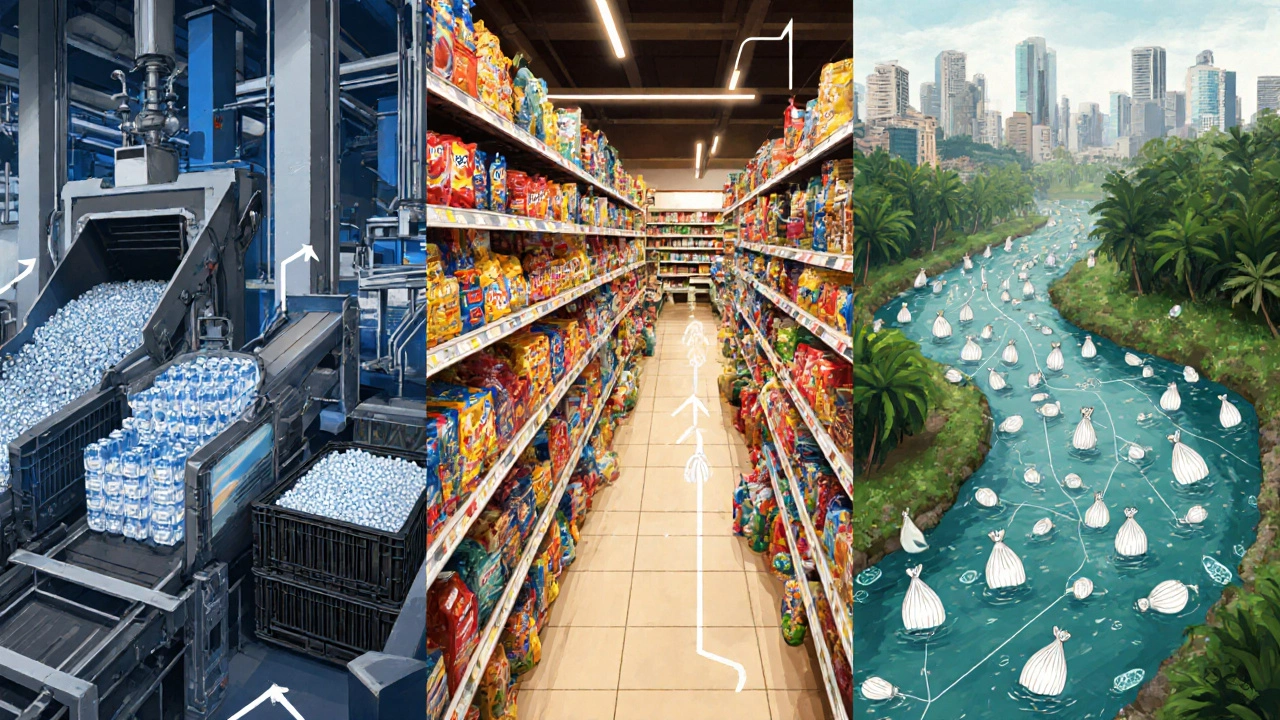
Plastic waste is any discarded plastic material that ends up in landfills, the environment, or the ocean. It includes everything from single‑use water bottles to industrial plastic scrap. Researchers typically break the data into two lenses:
- Total waste - the absolute mass of plastic discarded by a country in a calendar year, measured in million tonnes.
- Per‑capita waste - the average amount of plastic each resident discards, measured in kilograms per person per year.
Both metrics matter. A large country may dump huge volumes simply because of population size, while a smaller nation with a high per‑capita figure shows a cultural or systemic reliance on disposable plastics.
Top Five Countries by Total Plastic Waste (2023‑2024)
| Rank | Country | Annual waste (million tonnes) | Population (millions) | Per‑capita waste (kg/person) | Recycling rate (%) |
|---|---|---|---|---|---|
| 1 | China | 56.2 | 1,425 | 39.4 | 30 |
| 2 | United States | 42.5 | 334 | 127.2 | 28 |
| 3 | India | 25.9 | 1,425 | 18.2 | 12 |
| 4 | Indonesia | 13.5 | 277 | 48.7 | 19 |
| 5 | Brazil | 12.3 | 215 | 57.2 | 22 |
These figures come from the latest UNEP (United Nations Environment Programme) Global Plastics Outlook and the World Bank’s waste‑management database. While China’s total dwarfs others thanks to its massive manufacturing sector, the United States leads in per‑capita waste, meaning each American discards more plastic than most of the world’s citizens.
Why the Numbers Differ: Key Drivers of High Plastic Waste
Several forces push these countries to the top of the list:
- Economic structure - Nations with large manufacturing bases (China, India) generate plastic scraps alongside consumer waste.
- Consumer habits - High‑income societies (U.S., Australia) rely heavily on single‑use packaging, bottled water, and fast‑fashion items.
- Urbanisation speed - Rapid city growth in Indonesia and Brazil often outpaces waste‑collection infrastructure.
- Policy gaps - In many of these regions, extended‑producer‑responsibility (EPR) laws are either weak or unenforced.
When you combine these factors, the picture becomes clearer: it’s not just about the amount of plastic produced but about how that waste is captured, treated, or dumped.
Per‑Capita Plastic Waste: The Real Consumption Story
Looking at waste per person reveals a different set of leaders. The top per‑capita polluters in 2024 were:
- United States - 127kg/person
- Canada - 115kg/person
- Australia - 111kg/person
- United Kingdom - 106kg/person
- South Korea - 94kg/person
These nations share high disposable‑income levels, widespread availability of cheap single‑use items, and, in some cases, lagging recycling systems. For example, despite a strong recycling culture, the U.K. still recycles only about 30% of its plastic waste, meaning most ends up in landfills or incinerators.
Impact on Marine Pollution and the Global Plastic Budget
Marine debris refers to any plastic or other litter that reaches the ocean, either through direct dumping, river outflow, or wind‑driven transport. Studies estimate that roughly 8million tonnes of plastic enter the oceans each year - about 10% of the total global waste stream.
The countries topping the waste charts also dominate river‑mouth contributions. The Mekong (Vietnam, Cambodia, Laos), the Ganges (India, Bangladesh), and the Yangtze (China) collectively funnel more than 2.5million tonnes of plastic into marine environments annually.
When plastic ends up in the sea, it breaks down into micro‑plastics that infiltrate food chains, affect marine life, and even appear in bottled water. The economic cost of clean‑up, loss of tourism, and fisheries damage is estimated at $13billion per year worldwide.
What Countries Are Doing - Success Stories and Missed Opportunities
Some nations have turned the tide:
- Germany - With a 68% recycling rate, Germany’s “dual‑system” bottle collection and mandatory producer fees have cut domestic plastic landfill dramatically.
- Rwanda - Banned non‑essential plastic bags in 2008 and now enforces a strict “bag‑free” policy that has reduced litter by 90%.
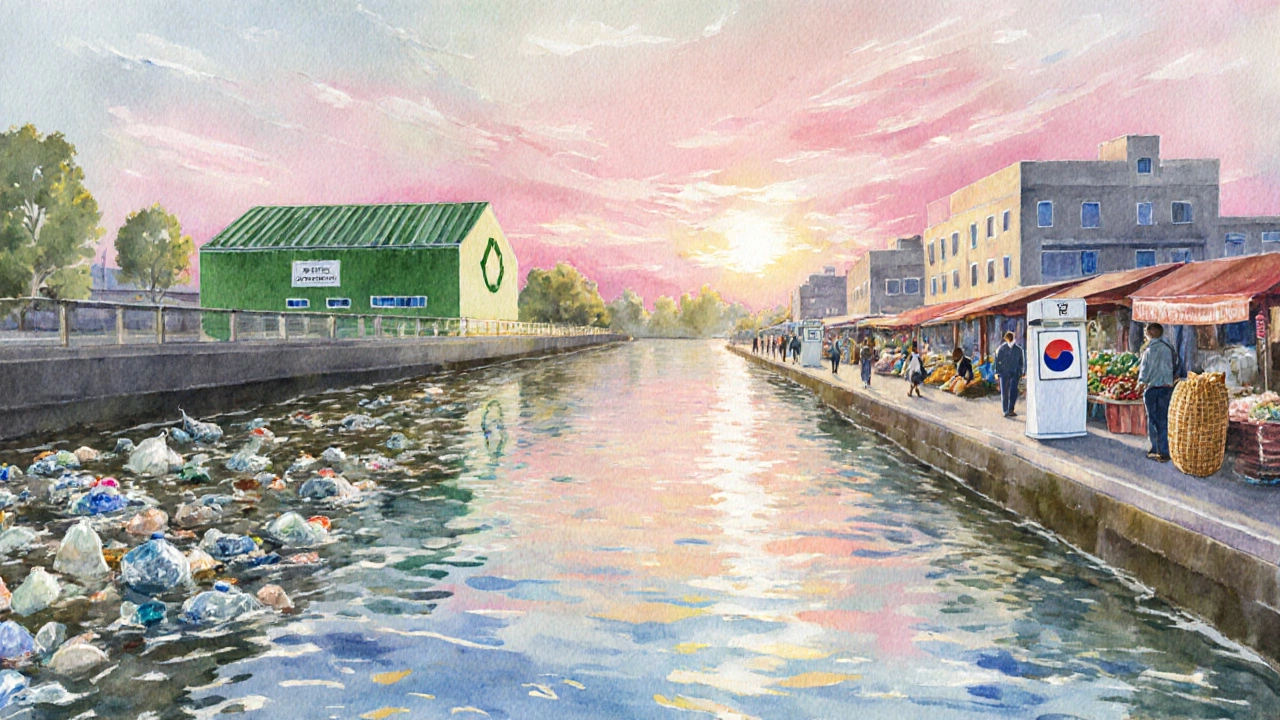
- South Korea - Introduced a “pay‑as‑you‑throw” levy on plastic containers in 2021, spurring a 20% drop in single‑use packaging within two years.
Meanwhile, high‑waste countries face obstacles:
- In the United States, the lack of a federal recycling mandate leads to a patchwork of state regulations, causing confusion and low participation.
- China’s recent “plastic ban” on thin‑film packaging (effective 2025) is still being rolled out; compliance costs for manufacturers are high, and illegal dumping persists in some coastal regions.
- Indonesia’s waste‑collection network covers only 60% of its urban population, leaving a large share of plastic to drift into rivers.
What Can Individuals Do? Practical Steps to Reduce Personal Plastic Footprint
Even if you live in a high‑waste country, everyday choices add up:
- Replace bottled water with a reusable bottle; a typical 500ml bottle creates about 30g of plastic per use.
- Choose bulk or refill stations for toiletries; avoiding a single‑use shampoo bottle saves roughly 15g per month.
- Carry a cloth bag for groceries - one bag can replace up to 1,500 plastic bags per year.
- Support brands that use recycled or biodegradable packaging; market demand drives corporate shifts.
- Participate in local clean‑up events; community action raises awareness and captures litter before it reaches waterways.
Tracking your own waste with a simple spreadsheet can reveal hidden habits - a personal audit often leads to a 10‑15% reduction within the first month.
Looking Ahead: The 2025 Outlook and Policy Trends
Global agreements are sharpening. The upcoming UN Ocean Conference (June2025) will push for a 30% reduction in plastic waste generation by 2030, with an emphasis on extended‑producer‑responsibility. The European Union is preparing a “single‑use plastics ban” that will expand to include cutlery, plates, and certain food‑container designs by late‑2025.
For the biggest waste contributors, the path forward likely involves a mix of stricter regulation, corporate redesign, and consumer education. If China fully enforces its thin‑film ban and the U.S. adopts a national recycling standard, the global plastic budget could shrink by up to 12% in the next five years.
Frequently Asked Questions
Which country generates the most plastic waste overall?
China leads the world, dumping around 56million tonnes of plastic each year, driven by its massive manufacturing sector and population.
Do per‑capita figures matter more than total waste?
Both metrics are useful. Total waste shows the sheer volume that needs management, while per‑capita numbers highlight consumer habits and can guide targeted education campaigns.
How much plastic ends up in the ocean each year?
Approximately 8million tonnes - roughly one‑tenth of global plastic waste - flow into the seas annually, according to the UN Environment Programme.
Which policies have proven most effective in cutting plastic waste?
Deposit‑return schemes for bottles, comprehensive EPR legislation, and bans on single‑use items paired with solid enforcement have yielded the biggest drops in waste across Europe and parts of Asia.
Can individuals really make a difference?
Yes. Simple habits like using reusable containers, avoiding plastic bags, and supporting recyclable packaging can cut personal waste by 10‑15% in a short period and create market pressure for larger change.